Address
Kaypian, San Jose Del Monte City, Bulacan Philippines
Work Hours
Monday to Friday: 8AM - 6PM
Weekend: 10AM - 5PM
Address
Kaypian, San Jose Del Monte City, Bulacan Philippines
Work Hours
Monday to Friday: 8AM - 6PM
Weekend: 10AM - 5PM


Integrated HR. Accurate Payroll.


Integrated HR. Accurate Payroll.

Human Resources has evolved from administrative record-keeping to a strategic, data-driven powerhouse. Yet, many HR teams still struggle to make sense of complex employee data.
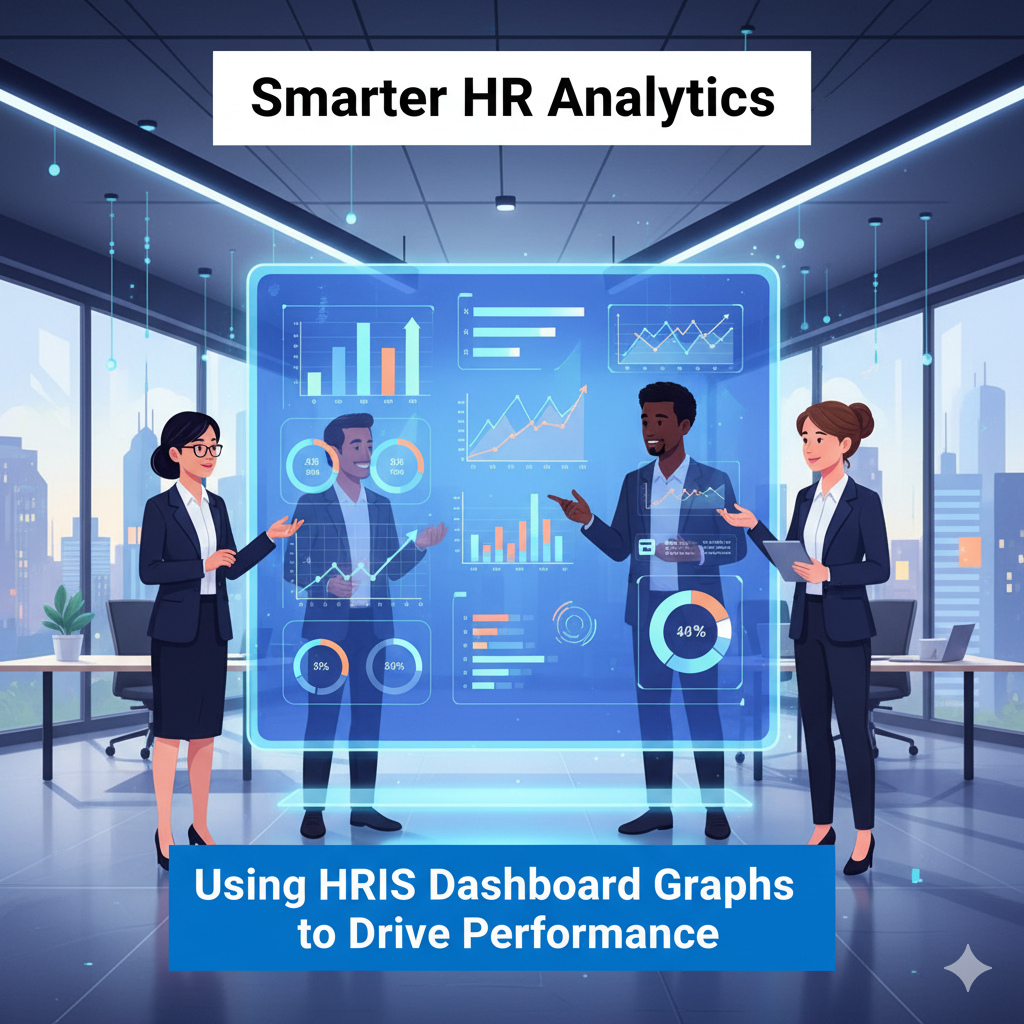
That’s where HRIS dashboard analytic graphs come in. By transforming raw HR data into visual, actionable insights, they empower HR professionals to make faster, smarter, and more confident decisions — all in one place.
Whether you’re monitoring employee performance, turnover, or engagement, HRIS dashboards are the key to unlocking the full potential of your workforce.
An HRIS (Human Resource Information System) dashboard is a centralized, visual reporting tool that compiles key HR metrics into easy-to-read charts and graphs.
Instead of sifting through spreadsheets or manual reports, HR managers can use the dashboard to:
Numbers tell a story — but graphs make it visible and understandable.
Here’s how analytic graphs in HRIS dashboards transform raw data into strategic insight:
Bar charts, line graphs, and pie charts simplify complex HR data. Instead of rows of numbers, HR leaders can see patterns instantly — like a rise in absenteeism or a drop in engagement.
With cloud-based HRIS dashboards, data updates automatically. HR managers can monitor performance trends, hiring progress, or turnover rates in real time, allowing proactive decision-making.
Performance graphs allow managers to evaluate progress toward goals, identify high-performing employees, and detect areas that need training or support.
Each department can customize their dashboard to focus on metrics that matter most — from diversity analytics to compensation equity.
Historical data visualized through graphs helps predict future trends. HR leaders can forecast hiring needs, identify seasonal turnover, or plan resource allocation effectively.
Data visualization eliminates guesswork. With clear insights into employee performance, attendance, and satisfaction, HR teams make more accurate and impactful decisions.
By identifying top performers and productivity gaps, HRIS dashboards help managers focus on training, motivation, and retention strategies that actually work.
Visualizing engagement survey results through graphs helps HR pinpoint pain points — such as departments with low morale — and take corrective action quickly.
Graphs and dashboards present information in a format that’s easy for both HR professionals and executives to understand. This fosters transparency and data-driven discussions across the company.
When HR analytics are tied to company objectives — like reducing turnover or improving performance — dashboards provide measurable evidence of HR’s strategic impact.
Modern HRIS systems are powered by cloud technology, which means HR professionals can access dashboards securely from any device.
Benefits include:
Cloud-based dashboards ensure HR insights are available anytime, anywhere, keeping HR leaders connected and informed.
Since HR dashboards handle sensitive employee data, security is critical.
Top HRIS solutions incorporate:
By safeguarding HR data, businesses can leverage analytics confidently and responsibly.
The next wave of HR dashboards is intelligent and predictive.
With AI and machine learning integration, HRIS systems can:
In the near future, HR professionals won’t just analyze data — they’ll anticipate outcomes before they happen.
In a data-driven world, HRIS dashboard analytic graphs are more than just visuals — they’re a strategic compass guiding HR decisions and performance management.
By embracing smarter HR analytics, organizations can:
If your HR department still relies on static reports, it’s time to modernize.
Start visualizing your HR data today — because better insight leads to better performance.